Step-by-step tutorial
Choose and complete financial analysis
Choose an appropriate financial scope and reconcile the finished analysis with your source data.
For brokers, analysts, and coordinators · 9 lessons (4 shared required)
Start tutorial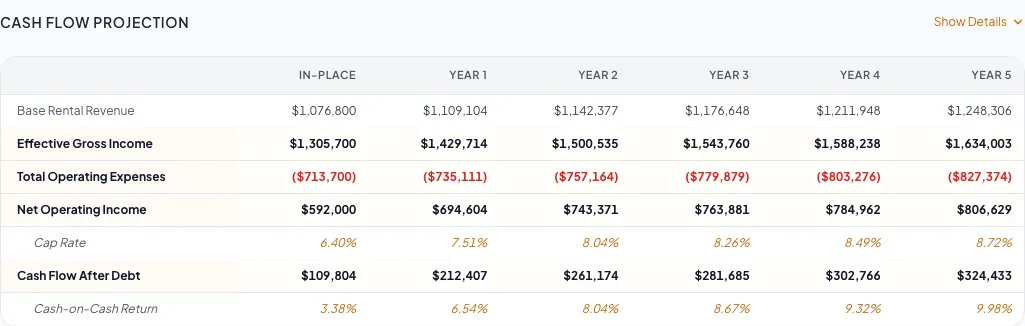
Follow along with video
2 short lessons · 2:13 total. Each lesson has captions, a transcript, and its written guide.
Before you start
- An existing document with the correct property type.
- The rent roll and operating data needed for your selected financial scope.
Your lessons
Open a lesson to follow the full guide. Follow one option in each choice group and include optional lessons only when their condition applies.
Required lessons
These lessons apply to either path. Use the original lesson numbers to complete your selected path in order.
Start with the financial overview
RequiredUnderstand the full sequence and source-data requirements.
Read guide30 to 60 minutes after source documents are organizedChoose financial scope
RequiredMatch Full, Rent Roll Only, Cap Rate & NOI, or Skip to the deliverable.
Verify the property type
RequiredConfirm which fields and financial behavior apply.
Read guide5 minutesVerify the finished output
RequiredReconcile calculated pages, footnotes, metrics, and expected omissions.
Choose your projection model
Follow the lesson for the model selected in your document. Multi-Year Cash Flow and in-place versus stabilized analysis are separate projection choices. Complete the matching lesson after the operating statement, then verify the finished output.
Multi-Year Cash Flow
Use a year-by-year projection with growth, lease, and sale assumptions.
Follow this pathConfigure cash-flow assumptions
Path lessonSet the assumptions used in your multi-year projection.
When to use this lesson: Use this lesson only for Multi-Year Cash Flow.
Read guide10 to 25 minutes
In-place versus stabilized
Compare the current operating result with a stabilized scenario.
Follow this pathComplete the pro-forma comparison
Path lessonCompare the in-place and stabilized operating results.
When to use this lesson: Use this lesson only for an in-place versus stabilized analysis.
Read guide20 to 45 minutes
Optional lessons
Complete these at their numbered point in the tutorial when their condition applies.
Choose the rent-roll model
OptionalSelect the projection and row-detail axes before entering data.
When to use this lesson: Use this lesson when your scope includes a rent roll.
Enter the operating statement
OptionalReconcile income, reimbursements, vacancy, expenses, and NOI.
When to use this lesson: Use this lesson when your scope includes an operating statement.
Apply portfolio guidance
OptionalCheck building-level data and portfolio totals.
When to use this lesson: Use this lesson only for multi-building or portfolio documents.
Read guide10 to 30 minutes depending on property count
Your next OM, done this afternoon
Turn your property facts, photos and financials into a polished, branded offering memorandum. Most brokers finish in 30 to 90 minutes.
No credit card required.